INVESTOR RELATIONS

Business Performance/Financial Information

Performance Information
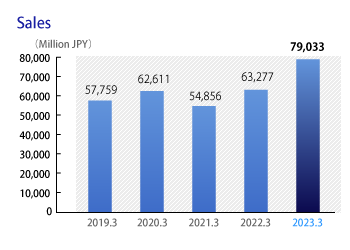
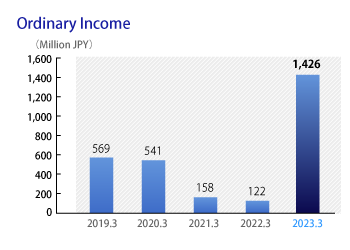
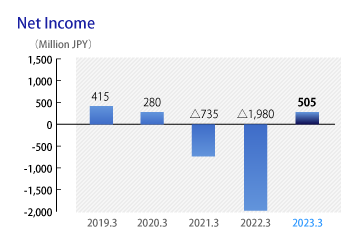
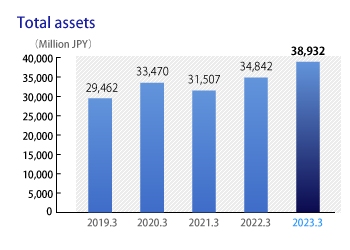
(Million JPY)

Operational Results YE2020 YE2021 YE2022 YE2023 YE2024
Sales 62,611 54,856 63,277 79,033 72,874
Operating Income 920 689 △361 1,537 1,888
Ordinary Income 541 158 122 1,426 1,570
Net Income 280 △735 △1,980 505 737
Net Income per share (JPY) 16.34 △44.12 △121.17 32.52  47.42 
Dividends per share(JPY) 5 4 5 6 7

* We have split each common share into 2 shares as of March 1, 2018.

(Million JPY)

Net Sales by
Business Segment
YE2020 YE2021 YE2022 YE2023 YE2024
Human
Solutions(HS)
21,685 19,135 22,088 23,260 22,695
Electronics
Manufacturing
Service(EMS)
27,046 24,054 28,400 38,157 34,290
Power
supply(PS)
13,879 11,666 12,788 17,615 15,888

(Million JPY)

Total assets/Net assets/
Equity ratio
YE2020 YE2021 YE2022 YE2023 YE2024
Total assets 33,470 31,507 34,842 38,932 35,976
Net assets 5,849 4,702 2,693 2,514 3,344
Equity ratio (%) 17.4 14.9 7.7 6.4 9.3

(Million JPY)

Net Cash flows YE2020 YE2021 YE2022 YE2023 YE2024
Cash flows from operating activities 1,816 943 △1,550 △253 4,772
Cash flows from investing activities △2,833 △919 △926 △1,613 △1,052
Cash flows from financing activities 976 664 2,601 △530 △3,092

(%)

Financial Indicators YE2020 YE2021 YE2022 YE2023 YE2024
Operating income ratio (%) 1.5 1.3 △0.6 1.9 2.6
ROE(%) 4.8 △14.0 △53.7 21.0 25.2
ROA(%) 1.7 0.5 0.4 3.9 4.2

Performance Graph

  • 売上高
  • 経常利益
  • 純利益
  • 総資産
  • 純資産
  • 自己資本利益率

PAGE TOP